Then with <F11>, the Window>Define Columns you edit the settings for each individual column or group of columns.
You can analyze the accounts on any report using the Custom Analysis window. You have control over the information displayed by setting the date range(s), the type of amounts (e.g. amount or quantity) and the partition tags (e.g. financial, order, budget).
NOTE: You can add new date range columns to the custom analysis window one at a time.
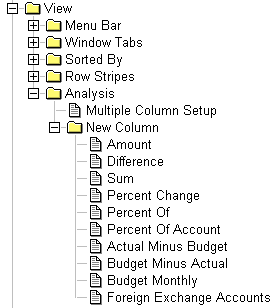
The View>Analysis>New Column menu option offers several choices.
| | Seven types of columns can be added. Then with <F11>, the Window>Define Columns you edit the settings for each individual column or group of columns. | |
| amount | adds a new amount column to the active custom analysis window. A generic analysis column that can be set to any date range, amount type, representation, etc. | |
| difference | adds a new difference column to the active custom analysis window. A formula column that sets the difference between two columns. | |
| sum | adds a new sum column to the active custom analysis window. A formula column that sets the sum of two columns. | |
| percent change | adds a new percent change column to the active custom analysis window. A formula column that sets the percent change between two columns. | |
| percent of | adds a new percent of column to the active custom analysis window. A formula column that sets the percent of between two columns. | |
| percent of account | adds a new percent of account column to the active custom analysis window. A formula column that sets the percent of an account. | |
| actual minus budget | adds three new budget columns to the active custom analysis window. A financial, budget and difference column. | |
| budget minus actual | adds three new budget columns to the active custom analysis window. A budget, financial and difference column. | |
(NOTE: for information on deleting columns please see Modifying Tables.)
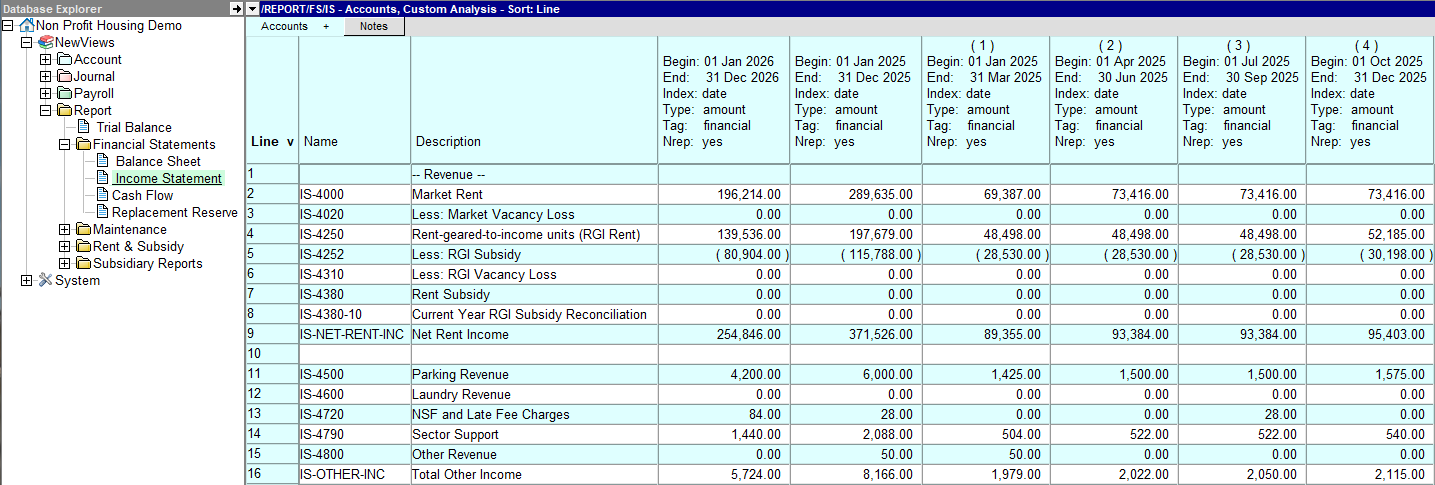
The income statement above had six columns added with the View>Analysis>New Column command. Above we see a 12-month comparative custom analysis by quarter for an income statement. The date range for the analysis is January 1, 2026 to December 31, 2026. The date ranges have been set by quarter and the amounts are financial amounts generated by all transactions that contribute to the account balance in the date range specified for each column (e.g. periodic amounts).
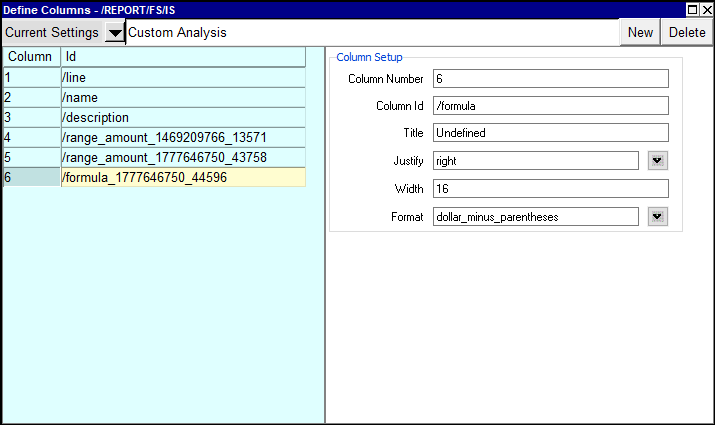
In order to create a custom analysis for any report, you must first add new amount columns and set up the columns for the analysis using the Define Columns window (<F11> or Window>Define Columns commands). Define Columns is used to specify the type of transaction that is used to generate amounts (or quantities), the date range for the analysis, whether the amounts are financial or non-financial (e.g. sales invoices (financial) or sales orders (non-financial)), and the format in which the amounts/quantities are displayed.
When the Window>Define Columns (or <Ctrl+F11>) command is issued, the following column setup table is displayed:

| The Setup Columns table's light blue left pane | |
| Column Number | These fields are generated by NV2, and correspond to columns position on screen. These are not editable fields. |
| Column Id | These fields are generated by NV2, and correspond to columns position on screen. These are not editable fields. |
| Line | Field | Options | Value | |
| 3 | Title | The title field will change the columns title from the systems default to the value entered in this field. | ||
| 4 | Justify | The justify field is used to format the displayed value in the report. Press <F3> to select between left and right. | ||
| 5 | Width | You can change the column width by entering a new value in this field. When you leave this field, you will see the columns width change accordingly. | ||
| 6 | Format | The number format field is used to format the amounts/quantities displayed in the report. Press <F3> to select between none, dollar_minus_parentheses, dollar_minus_trailing, dollar and integer. | ||
| 7 | Index | 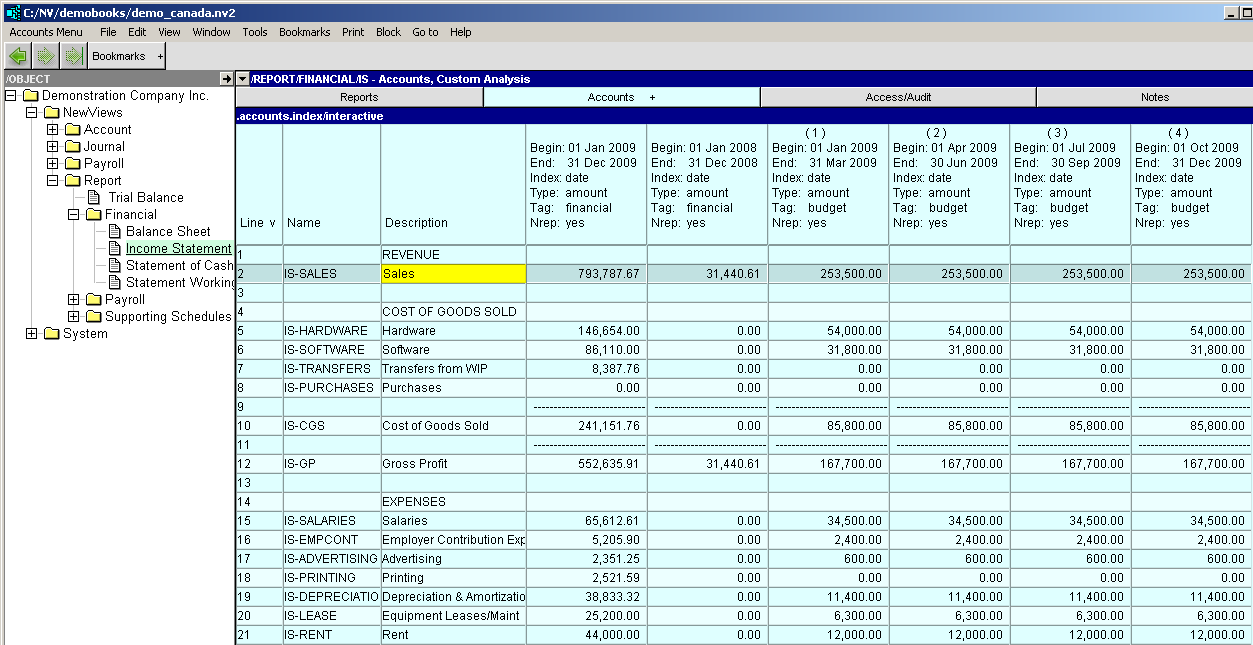 | The index field is used to specify the type of transaction that is used to generate analysis amounts or quantities. Press <F3> and the box on the left appears, click with the mouse to select the index. | |
| .index/date .index/date/debit .index/date/credit .index/date/closed .index/date/open | date - selects all transactions sorted by date. debit - selects only debit transactions sorted by date. credit - selects only credit transactions sorted by date. closed - selects only closed (reconciled) transactions sorted by date. open - selects only open (unreconciled) transactions sorted by date. | |||
| 8 | Amount Type |  | Determines what type of amount is displayed. Press <F3> and the box on the left appears, click with the mouse to select the amount type. | |
| .count .amount .quantity | count - displays a count of the items (e.g. the number of transactions). amount - displays the currency amount. quantity - displays the quantity, unit of measure insensitive. | |||
| 9 | Tag |  | The Tag field is used to select specific types of transactions (e.g. financial, order, budget, etc.). | |
| 10 | Begin Date | The range Begin Date can be selected from a calendar by pressing <F3>. The interpretation of Begin Date splits into two worlds, depending on the value of the Respect Normal Rep field (see below). | ||
| 11 | End Date | The range End Date can be selected from a calendar by pressing <F3>. | ||
| 12 | Respect Normal Rep | You have the option of respecting or ignoring an account's normal representation. If you set the Respect Normal Rep option to no, the amount displayed is the sum of postings dated within the period specified for the range, regardless of the account's normal representation. NOTE: This is exactly how NV1 behaves. | ||
Activate the report for which the custom analysis is to be setup.
If the Custom Analysis window is not displayed (the title bar should read /REPORT/(report name) - Custom Analysis), use the window select button at the left of the title bar to choose the Custom Analysis window.
To add a new column you want to see amounts for, select View>Analysis>New Column>Amount activate any amount in new amount column and press <F11>, the Setup Columns key. (NOTE: for information on deleting columns please see Modifying Tables.)
Make sure that the new column number is active on the left side of the Setup Columns table, and then activate the Tag field on the right side of the table. Update the tag type (financial, non-financial, budget) for the column.
Next edit the Begin Date field to be the begin date for the budget period. For example, if you are budgeting for the entire year of 2026, the Begin Date field would be 20260101.
Edit the End Date field to be the end date for the budget period. For example, if you are budgeting for the entire year of 2026, the End Date field would be 20261231.
Continue this process of adding and modifying columns until all required columns are added.
Activate the custom analysis view where you wish to add a difference column.
If the Custom Analysis window is not displayed (the title bar should read /REPORT/(report name) - Custom Analysis), use the window select button at the left of the title bar to choose the Custom Analysis window.
To add a new a difference column, select View>Analysis>New Column>Difference activate any amount in new difference column and press <Ctrl+F11>, the Setup Columns key.
Modify the values for the difference column as required. These changes will be reflected on screen.
NOTE: the difference column will calculate the difference for the two columns prior to where it is inserted.