Tables of accounts (blue) have commands, Tools>Totalto>Graph Above and Tools>Totalto>Graph Below, that draw graphs of the totaling structure. Position on any account row in a table of accounts (blue), or select a set of accounts in the table, issue one of these commands, and NewViews will displays a graph of the total structure above or below the selected accounts.
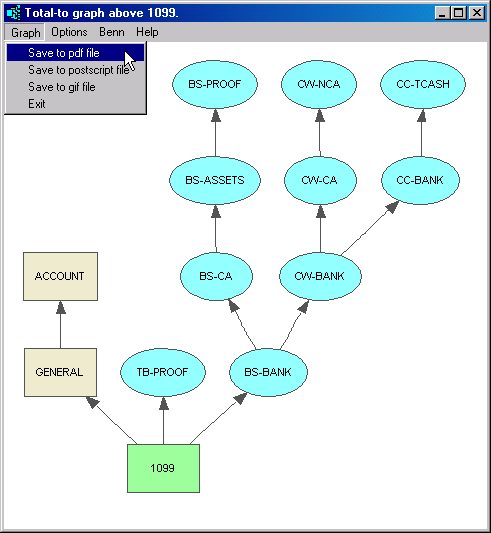
In the figure above, the Tools>Totalto>Graph Above command was issued while positioned on 1060, a bank account. As a result, the total-to structure above the account is displayed in a graph.
You can change the fonts, colors, styles, and so on, and decide what information to display in graph nodes. In the example above we display the account name and description, as well as the description of the account's report. This makes it easy to see that the bank account affects other accounts on several reports including the balance sheet, and two statements of changes in financial position, one based on working capital and another on cash.
This graph shows accounts below the balance sheet proof account to a maximum depth of three.
There are several places within the set of books that you can issue the totalto graph commands and a number of ways that you can select a set of accounts:
On any table of accounts (blue):
If no block is marked, the graph will be displayed for the single account on which you are currently positioned. If you select a set of accounts using block commands, the graph will be displayed for all accounts above/below the entire set of selected accounts.
On transactions:
See Totalto Graphs for Transactions for more.
On the proof control view:
Click the NewViews object in a tree explorer and then click on the Proof Control tab to display the proof control view. Each row of the proof control view has a field with a list of proof accounts. Although the proof control view was designed to be used for proof control operations, you can use it for other things as well, such as specifying a set of accounts for use of total-to graphs. Add one or more rows, giving them appropriate names and descriptions, and simply do not fill in the Tag List field. Any row with an empty tag list is skipped by any proof check operations, so it can be used for other purposes without interfering with proof check operations.
If you position on a proof control row and issue a total graph above or below command, the graph will use the set of accounts in the Proof Account List field. Or you can select a set of proof control rows and union of the accounts in their Proof Account List fields will be used.
Using these techniques, the proof control view is a playground for specifying accounts to be used in the display to total-to graphs. Your account selections are also persistent because they are stored in proof control rows.
You can capture a total graph to any of the formats listed below in order to further manipulate or print the graph.
PDF - Portable Document Format
EPS - Encapsulated Postscript
GIF - Graphics Interchange Format
Particularly useful, a totalto graph can be saved as a PDF file. Opening a PDF file requires that you have a PDF reader. The most popular is Adobe Reader, available as free download at get.adobe.com/reader Once the file is opened with Adobe Reader, you may resize the graph on screen. There are many print scaling and size options within Adobe Reader.