Reports in NewViews are not generated (with some exceptions). Reports are real time and always available. Reporting in NewViews involves navigating to a report, selecting the appropriate view and setting the appropriate dates.
Setting the dates and ranges for the various reports and account tables is done using the Window>Define Columns command or (shortcut <F11>).
You can analyze the accounts on any report using the Custom Analysis window. You have control over the information displayed by setting the date range(s), the type of amounts (e.g. amount or quantity) and the tags (e.g. financial, order, budget).
To set the date range for an individual Custom Analysis column, edit the Begin and End Date fields on the column setup prompt.

The Single Period Report window is used to display account balances for a specific period in a formatted report. You have control over the date range, the type of amounts (or quantities) that are displayed, and how they are sorted.
To set the date range for the five column Single Period Window, edit the Begin and End Date fields on the column setup prompt.

As a default, the Budget window contains three amount columns used for budgeting purposes. These columns are linked by the period specified in the Begin and End date fields, and all three columns must be treated as a unit. The first amount column displays financial (actual) amounts for the period, the second amount column displays budget amounts, and the third column displays the difference between the first two.
To set the date range for the three budget amount columns, edit the Begin and End Date fields on the column setup prompt.

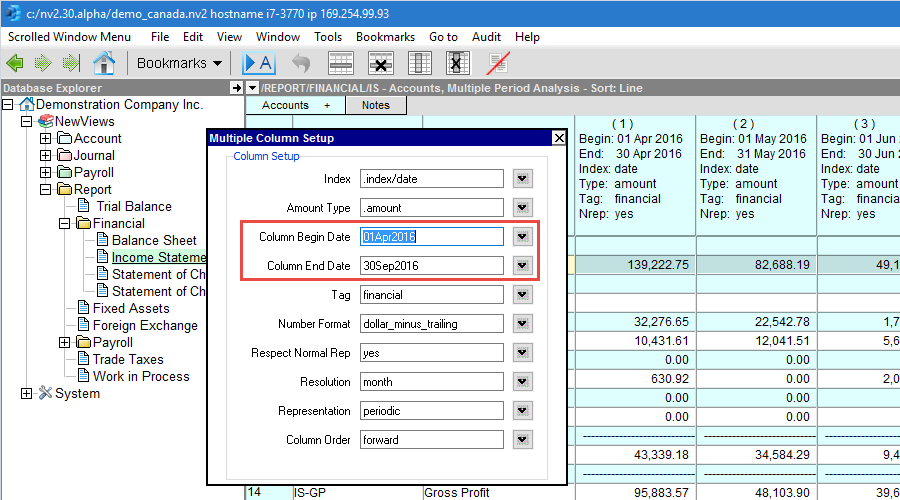
You can analyze the accounts on any report using the Multiple Period Analysis window. You have control over the date range(s) for the analysis you want to perform.