Consolidation Analysis prints a report with analysis columns based on the subsidiary reports from which account balances are totaled.
Example:
The Consolidation Analysis will have five amount columns:
Click here for instructions on how to print a Consolidation Analysis.
Click here for explanations on the Consolidation Analysis printing options.
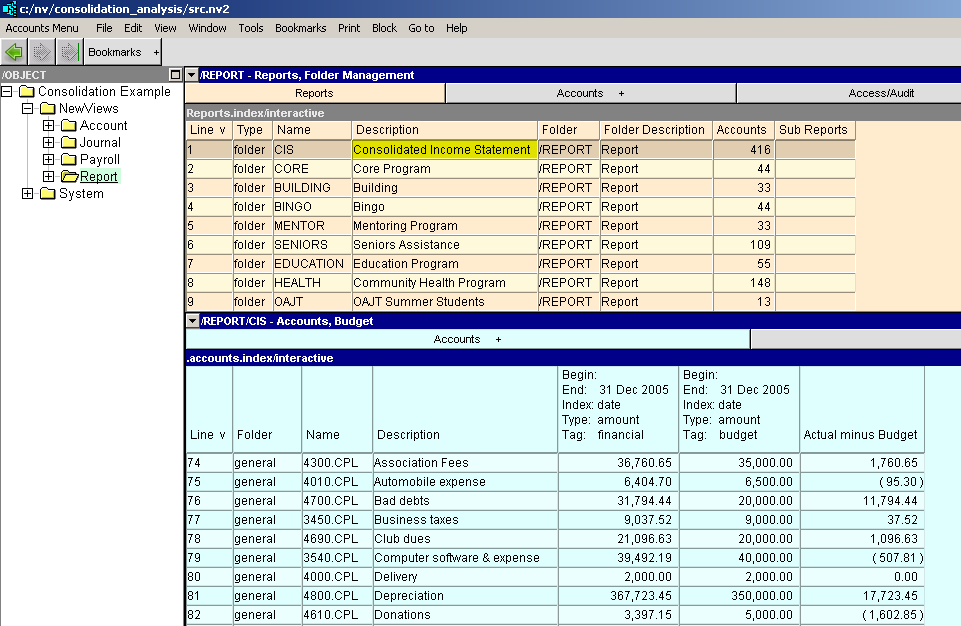
The image below shows the report table with the Consolidated Income Statement selected. This report has nineteen "subsidiary" report below it - each contribute amounts to the consolidated report.
The bottom pane is a custom analysis window showing actual, budget, and variance amounts for the period April 2006 to March 2007.
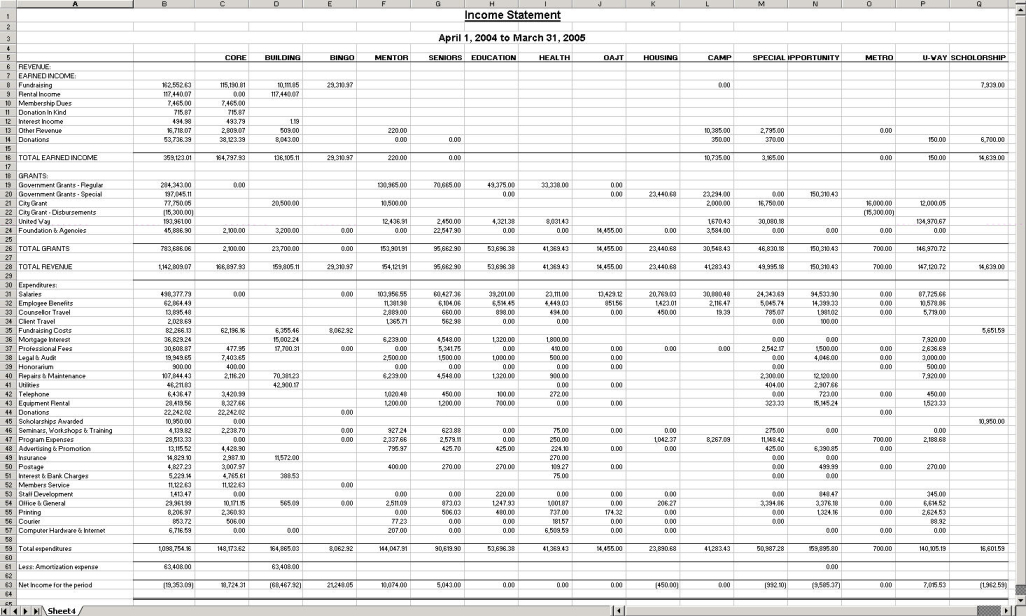
This is the resulting Consolidation Analysis displayed in Excel. (The report contains only fifteen report columns because the option to suppress zero-amount columns was used.)