Custom Analysis in NewViews
Custom Analysis is a versatile tool for analyzing reports. Multiple Period Analysis (another versatile tool) allows you to quickly and easily create a comparative analysis of amounts over a date range with custom resolution, but all columns share the same index, amount type, tag and representation. With Custom Analysis, you can set the date range, index, amount type, tag and representation for each individual column to meet your unique analysis needs.
Several column types, in any combination, can be added to a Custom Analysis. For the purposes of this article, will be be focusing on the first 6 types – amount, difference, sum, percent change, percent of, and percent of account.
Amount columns are the most commonly used. Calculated columns (difference, sum, percent change, percent of) can be added once the two amount columns used for the calculation have been added.
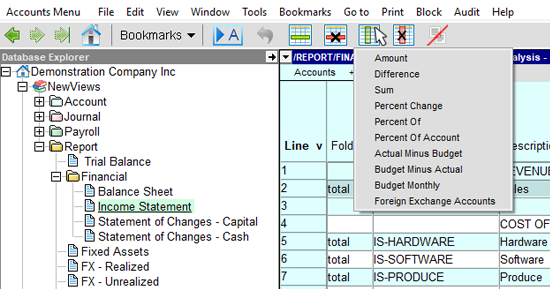
| amount | Displays amounts for a given date range, index, amount type, tag and representation. This type of column is the most commonly used. |
| difference | Displays the difference between the two preceding amount columns (i.e. displays the results of subtracting amounts in the 1st column from the 2nd column). |
| sum | Displays the sum of the two preceding amount columns. |
| percent change | Displays the percentage change between the two preceding amount columns (i.e. displays the % change of the 2nd column with respect to the 1st). |
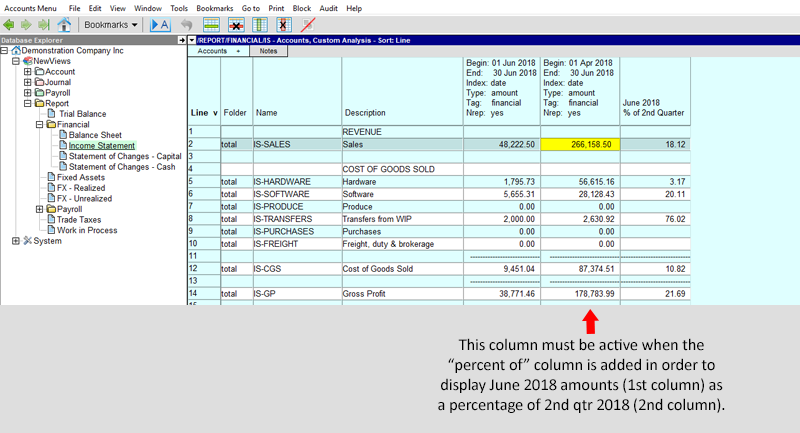
| percent of | Displays an amount column as a percentage of the column that follows it (i.e. displays amounts in the 1st column as a percentage of the 2nd column). |
| percent of account | Displays amounts in a given date range as percentages of a specified account. |
| actual minus budget | Adds 3 budget columns – financial amounts, budget amounts and actual minus budget amounts. See Budgeting in the User Manual for details. |
| budget minus actual | Adds 3 budget columns – financial amounts, budget amounts and budget minus actual amounts. See Budgeting in the User Manual for details. |
| budget monthly | Adds a column that can be used to enter budget amounts. See Budgeting in the User Manual for details. |
| foreign exchange accounts | See Foreign Currency Translation in the User Manual for details |
As new columns are added to the Custom Analysis view, they are appended to the end; they can be moved later. Important! When adding a calculated column (i.e. difference, sum, percent change, percent of), the cursor MUST be positioned in the second of the two columns to be used in the calculation to get the desired results.
Once added, columns are defined individually by double clicking the column header, or as a group using the Window > Define Columns command (Ctrl+F11).
You can create any number of Custom Analysis views by saving each group of column definitions with a unique name.
Setting Up a Custom Analysis
- Access the report for which custom analysis is to be set up.
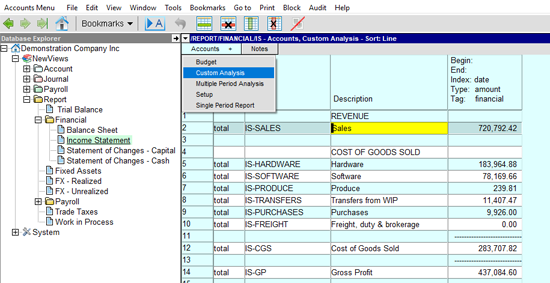
- If the Custom Analysis view is not displayed, click the Accounts + tab to change the view to Custom Analysis.
- The default Custom Analysis view displays 5 columns: line, folder, account name, account description and one amount column.
- Columns can be added quickly by clicking the New Column button
 on the NewViews Toolbar. Note that new columns are always added to the right of the last column, although they can subsequently be moved.
Important! When adding columns that display calculations based on two columns (i.e. difference, sum, percentage change, percent of), take care to do the following: 1) make sure the two columns upon which the calculated column is based are in the right order to provide the desired calculation, and 2) make sure the cursor is positioned in the 2nd of the two columns when you add the new column. NewViews will remember the relationship between those three columns and maintain it, even if any or all of the columns are repositioned.

- Once a new column is added, it must be defined. You can choose to define columns as they are added, or define them all at once after they have been added, or any combination of these two approaches.
- To define an individual column, double click the column header. Fill in the fields, using the chart below as a guide for column setup.
| Column Types: Amount, Percent of Account | |
| Begin Date | begin date for range |
| End Date | end date for range |
| Index | date – all transactions date/debit – debit transactions date/credit – credit transactions date/closed – closed transactions date/open – open transactions date1 – orders (purchase or sales) |
| Amount Type | count amount quantity |
| Tag (list will include any custom allocation tags) |
budget financial order |
| Respect Normal Rep | yes no – amount displayed is the sum of postings within the date range, regardless of the account’s normal representation |
| Percent of Account (Percent of Account column only) |
account to be used for “percent of” calculation |
| Column Types: Difference, Sum, Percent Change, Percent of | |
| Column Number | Correspond to the column’s position. These fields are generated by NewViews and cannot be edited directly. |
| Column Id | |
| Title | Custom title for the column. The following variables can be used for data substition:
%_today – today’s date |
| Justify | left – column contents will be left justified right – column contents will be right justified |
| Width | column width (number of characters) |
| Format | format for numeric amounts |
- To define all the columns after they have been added (or at any point in the process), use the Window > Define Columns command or press Ctrl + F11.

- In the blue table on the left of the Define Columns prompt, the position of each column is numbered and the active column is highlighted. The columns you have added will either start with /range_amount (amount and percentage of account columns) or /formula_ (difference, sum, percent change and percent of columns).
- Navigate to each in column in turn use the fields in the white table on the right to complete the setup (see chart above).
- To save your custom analysis as a new view (i.e. it is presented when you click the Accounts + tab), click New at the top of the prompt and enter a unique name for the settings. (Note: If this analysis is only relevant for a particular report, you may want to use the report name as a prefix for ease of identification.)
More Examples
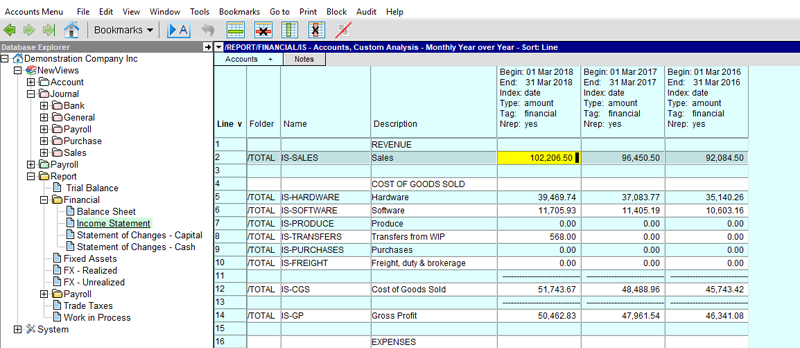
Monthly Comparison Year to Year
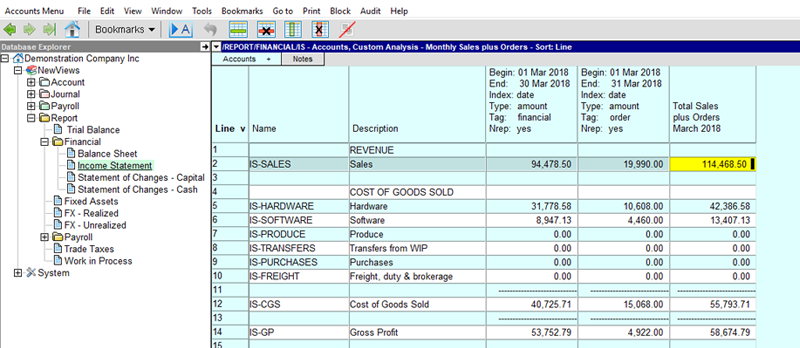
Monthly Sales plus Orders
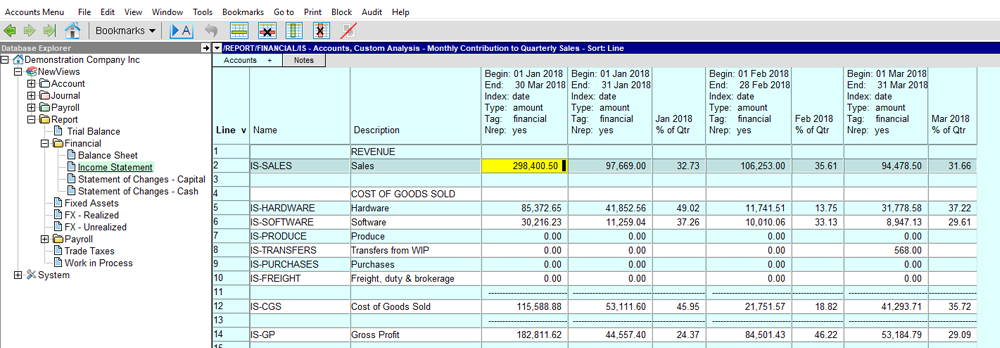
Monthly P/L as % of Quarter
Note: For this analysis, the quarterly amount column was added first. As each monthly amount column was added, it was repositioned to the left of the quaterly column in order to add the corresponding “percent of” column, then moved again to its final position.